Multilevel model of accuracy
Params:
params
$dv_var
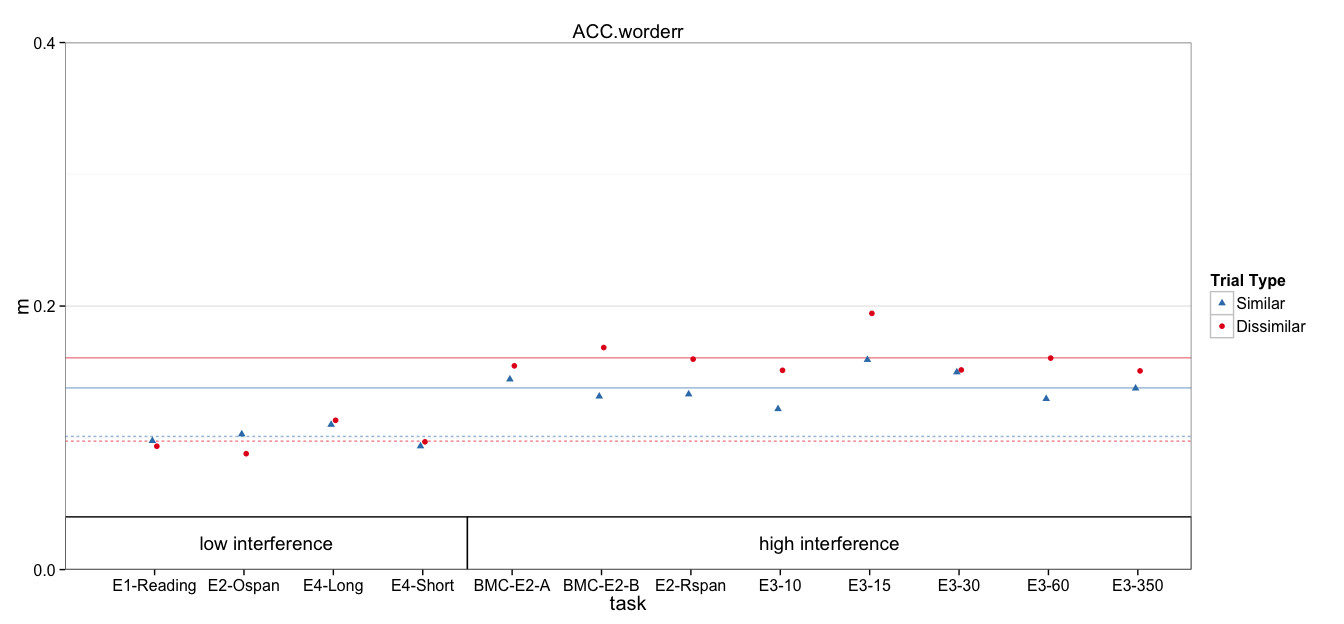
[1] "ACC.worderr"
$nsim
[1] 10000
$plot_ymax
[1] 0.4
$plot_yshift
[1] 0
Read in data
DV_VAR = params$dv_var

all.dat = read.csv('data/1_scored.csv')
all.dat$Subject = factor(all.dat$Subject)
all.dat$dv = all.dat[,DV_VAR]

# Remove regular ospan, which has substantially lower accuracy
# due to verification requirements
dat = subset(all.dat, !task %in% 'Ospan.reg')

# Mark high and low interference conditions
low_int = c('spOspan.noVer', 'Ospan.scram.noVer', 'Rspan.names.long', 'Rspan.names.short', 'Ospan.reg')
dat$interference = ifelse(dat$task %in% low_int, 'low', 'high')
Models
dat$cond = paste(dat$interference, dat$trialtype)
contrasts(dat$trialtype) <- c(0,1)                # similarity increment
Model with recall predictions for each interference:trialtype explicit
fit.mlm = lmer(dv ~ 0 + cond + (1 | task:Subject) + (1 | task), data=dat)
summary(fit.mlm)
Linear mixed model fit by REML ['lmerMod']
Formula: dv ~ 0 + cond + (1 | task:Subject) + (1 | task)
   Data: dat

REML criterion at convergence: -964.2

Scaled residuals:
     Min       1Q   Median       3Q      Max
-1.71366 -0.52103 -0.00499  0.48096  2.71977

Random effects:
 Groups       Name        Variance Std.Dev.
 task:Subject (Intercept) 0.004615 0.06794
 task         (Intercept) 0.000000 0.00000
 Residual                 0.001454 0.03813
Number of obs: 368, groups:  task:Subject, 184; task, 12

Fixed effects:
           Estimate Std. Error t value
condhigh D 0.160714   0.007361   21.83
condhigh S 0.137897   0.007361   18.73
condlow D  0.097479   0.009181   10.62
condlow S  0.101080   0.009181   11.01

Correlation of Fixed Effects:
           cndhgD cndhgS cndlwD
condhigh S 0.760
condlow D  0.000  0.000
condlow S  0.000  0.000  0.760
Same model contrast coded for similarity benefit
fit.mlm.con = lmer(dv ~ 0 + interference/trialtype + (1 | task:Subject) + (1 | task), data=dat)
summary(fit.mlm.con)
Linear mixed model fit by REML ['lmerMod']
Formula: dv ~ 0 + interference/trialtype + (1 | task:Subject) + (1 | task)
   Data: dat

REML criterion at convergence: -964.2

Scaled residuals:
     Min       1Q   Median       3Q      Max
-1.71366 -0.52103 -0.00499  0.48096  2.71977

Random effects:
 Groups       Name        Variance Std.Dev.
 task:Subject (Intercept) 0.004615 0.06794
 task         (Intercept) 0.000000 0.00000
 Residual                 0.001454 0.03813
Number of obs: 368, groups:  task:Subject, 184; task, 12

Fixed effects:
                             Estimate Std. Error t value
interferencehigh             0.160714   0.007361  21.832
interferencelow              0.097479   0.009181  10.617
interferencehigh:trialtype1 -0.022817   0.005095  -4.478
interferencelow:trialtype1   0.003601   0.006355   0.567

Correlation of Fixed Effects:
            intrfrnch intrfrncl intrfrnch:1
interfrnclw  0.000
intrfrnch:1 -0.346     0.000
intrfrncl:1  0.000    -0.346     0.000
Same model contrast coded for interference benefit
fit.mlm.int = lmer(dv ~ 0 + trialtype/interference + (1 | task:Subject) + (1 | task), data=dat)
summary(fit.mlm.int)
Linear mixed model fit by REML ['lmerMod']
Formula: dv ~ 0 + trialtype/interference + (1 | task:Subject) + (1 | task)
   Data: dat

REML criterion at convergence: -964.2

Scaled residuals:
     Min       1Q   Median       3Q      Max
-1.71366 -0.52103 -0.00499  0.48096  2.71977

Random effects:
 Groups       Name        Variance Std.Dev.
 task:Subject (Intercept) 0.004615 0.06794
 task         (Intercept) 0.000000 0.00000
 Residual                 0.001454 0.03813
Number of obs: 368, groups:  task:Subject, 184; task, 12

Fixed effects:
                            Estimate Std. Error t value
trialtypeD                  0.160714   0.007361  21.832
trialtypeS                  0.137897   0.007361  18.733
trialtypeD:interferencelow -0.063235   0.011768  -5.374
trialtypeS:interferencelow -0.036817   0.011768  -3.129

Correlation of Fixed Effects:
            trltyD trltyS trltD:
trialtypeS   0.760
trltypD:ntr -0.626 -0.476
trltypS:ntr -0.476 -0.626  0.760
Why is task variance estimated to be 0?
Sanity check, injecting noise at task level. Note the accurate task variance estimates.
tmp_dat = ddply(dat, .(task), transform, dv = dv + rnorm(1, sd=.1))
fit.mlm2 = lmer(dv ~ 0 + cond + (1 | task:Subject) + (1 | task), data=tmp_dat)
summary(fit.mlm2)
Linear mixed model fit by REML ['lmerMod']
Formula: dv ~ 0 + cond + (1 | task:Subject) + (1 | task)
   Data: tmp_dat

REML criterion at convergence: -925.2

Scaled residuals:
     Min       1Q   Median       3Q      Max
-1.70137 -0.48742 -0.01469  0.46660  2.61044

Random effects:
 Groups       Name        Variance Std.Dev.
 task:Subject (Intercept) 0.004846 0.06961
 task         (Intercept) 0.008386 0.09158
 Residual                 0.001454 0.03813
Number of obs: 368, groups:  task:Subject, 184; task, 12

Fixed effects:
           Estimate Std. Error t value
condhigh D  0.16418    0.03329   4.931
condhigh S  0.14137    0.03329   4.246
condlow D   0.07070    0.04674   1.513
condlow S   0.07430    0.04674   1.590

Correlation of Fixed Effects:
           cndhgD cndhgS cndlwD
condhigh S 0.988
condlow D  0.000  0.000
condlow S  0.000  0.000  0.991
Another Sanity check, looking at task variance from ANOVA standpoint. Note that the F-value for task is 1 (no between task var beyond subject var)
fit.aov = aov(dv ~ interference + task + Error(task:Subject), data=dat)
Warning in aov(dv ~ interference + task + Error(task:Subject), data =
dat): Error() model is singular
summary(fit.aov)
Error: task:Subject
              Df Sum Sq Mean Sq F value   Pr(>F)
interference   1 0.2194 0.21936  19.678 1.63e-05 ***
task          10 0.0273 0.00273   0.245    0.991
Residuals    172 1.9173 0.01115
---
Signif. codes:  0 '***' 0.001 '**' 0.01 '*' 0.05 '.' 0.1 ' ' 1

Error: Within
           Df Sum Sq  Mean Sq F value Pr(>F)
Residuals 184 0.2942 0.001599
Confidence Intervals
Computing bootstrap confidence intervals ...
Warning in checkConv(attr(opt, "derivs"), opt$par, ctrl =
control$checkConv, : Model failed to converge: degenerate Hessian with 1
negative eigenvalues
                                 2.5 %     97.5 %
sd_(Intercept)|task:Subject 0.05918974 0.07563250
sd_(Intercept)|task         0.00000000 0.01944103
sigma                       0.03423246 0.04199551
condhigh D                  0.14640067 0.17535860
condhigh S                  0.12333139 0.15248948
condlow D                   0.07922289 0.11554392
condlow S                   0.08323373 0.11917696
Computing bootstrap confidence intervals ...
                                   2.5 %      97.5 %
sd_(Intercept)|task:Subject  0.059272761  0.07552991
sd_(Intercept)|task          0.000000000  0.01929735
sigma                        0.034142129  0.04207234
interferencehigh             0.145998438  0.17511428
interferencelow              0.079569191  0.11578560
interferencehigh:trialtype1 -0.032926816 -0.01258058
interferencelow:trialtype1  -0.008985965  0.01599783
Cohen's d
Here, I divided group differences by either the residual variance, or between-subject variance + residual variance.
$d_high
BOOTSTRAP CONFIDENCE INTERVAL CALCULATIONS
Based on 10000 bootstrap replicates

CALL :
boot.ci(boot.out = booted, type = c("norm", "perc"), index = ii)

Intervals :
Level      Normal             Percentile
95%   (-0.6141, -0.2263 )   (-0.6272, -0.2356 )
Calculations and Intervals on Original Scale

$d_low
BOOTSTRAP CONFIDENCE INTERVAL CALCULATIONS
Based on 10000 bootstrap replicates

CALL :
boot.ci(boot.out = booted, type = c("norm", "perc"), index = ii)

Intervals :
Level      Normal             Percentile
95%   (-0.1617,  0.2984 )   (-0.1624,  0.2964 )
Calculations and Intervals on Original Scale

$d_sub_high
BOOTSTRAP CONFIDENCE INTERVAL CALCULATIONS
Based on 10000 bootstrap replicates

CALL :
boot.ci(boot.out = booted, type = c("norm", "perc"), index = ii)

Intervals :
Level      Normal             Percentile
95%   (-0.3800, -0.1414 )   (-0.3859, -0.1466 )
Calculations and Intervals on Original Scale

$d_sub_low
BOOTSTRAP CONFIDENCE INTERVAL CALCULATIONS
Based on 10000 bootstrap replicates

CALL :
boot.ci(boot.out = booted, type = c("norm", "perc"), index = ii)

Intervals :
Level      Normal             Percentile
95%   (-0.1006,  0.1855 )   (-0.1013,  0.1854 )
Calculations and Intervals on Original Scale
Plotting
Means and Standard Errors
The following `from` values were not present in `x`: Ospan.reg
p +
  geom_rect(aes(x=NULL, y=NULL, shape=NULL,xmin=xmin, xmax=xmax, ymin=ymin, ymax=ymax),
            color='black', fill='white', data=group_annot) +
  geom_text(aes(shape=NULL, color=NULL, x=text.x, y=text.y, label=label),
            show_guide=FALSE, data=group_annot) + pub_theme + colors + shapes
Scale for 'colour' is already present. Adding another scale for 'colour', which will replace the existing scale.
Scale for 'shape' is already present. Adding another scale for 'shape', which will replace the existing scale.
ymax not defined: adjusting position using y instead
title: "1_mlm.R" author: "machow" date: "Wed Jan 13 12:22:34 2016"