Multilevel model of accuracy
Params:
params
$dv_var
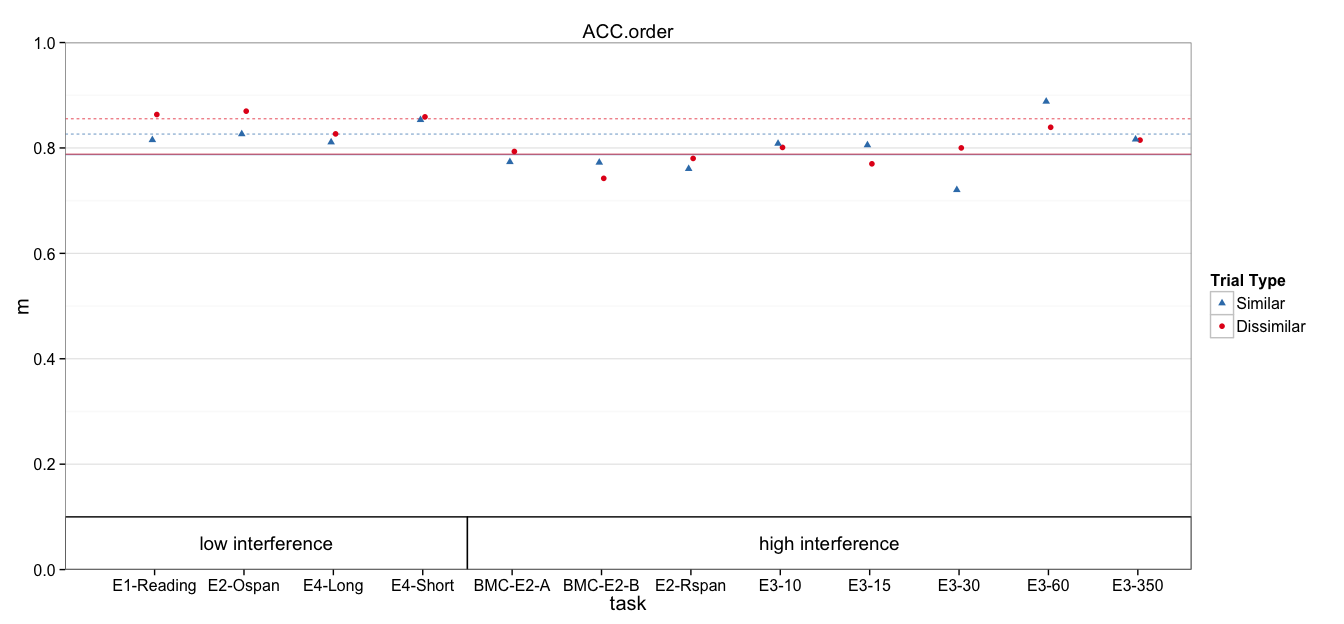
[1] "ACC.order"
$nsim
[1] 10000
$plot_ymax
[1] 1
$plot_yshift
[1] 0
Read in data
DV_VAR = params$dv_var

all.dat = read.csv('data/1_scored.csv')
all.dat$Subject = factor(all.dat$Subject)
all.dat$dv = all.dat[,DV_VAR]

# Remove regular ospan, which has substantially lower accuracy
# due to verification requirements
dat = subset(all.dat, !task %in% 'Ospan.reg')

# Mark high and low interference conditions
low_int = c('spOspan.noVer', 'Ospan.scram.noVer', 'Rspan.names.long', 'Rspan.names.short', 'Ospan.reg')
dat$interference = ifelse(dat$task %in% low_int, 'low', 'high')
Models
dat$cond = paste(dat$interference, dat$trialtype)
contrasts(dat$trialtype) <- c(0,1)                # similarity increment
Model with recall predictions for each interference:trialtype explicit
fit.mlm = lmer(dv ~ 0 + cond + (1 | task:Subject) + (1 | task), data=dat)
summary(fit.mlm)
Linear mixed model fit by REML ['lmerMod']
Formula: dv ~ 0 + cond + (1 | task:Subject) + (1 | task)
   Data: dat

REML criterion at convergence: -507.1

Scaled residuals:
     Min       1Q   Median       3Q      Max
-2.80132 -0.47517  0.07994  0.51863  1.67146

Random effects:
 Groups       Name        Variance Std.Dev.
 task:Subject (Intercept) 0.011410 0.10682
 task         (Intercept) 0.000000 0.00000
 Residual                 0.006525 0.08078
Number of obs: 368, groups:  task:Subject, 184; task, 12

Fixed effects:
           Estimate Std. Error t value
condhigh D  0.78811    0.01265   62.28
condhigh S  0.78741    0.01265   62.22
condlow D   0.85547    0.01578   54.20
condlow S   0.82632    0.01578   52.36

Correlation of Fixed Effects:
           cndhgD cndhgS cndlwD
condhigh S 0.636
condlow D  0.000  0.000
condlow S  0.000  0.000  0.636
Same model contrast coded for similarity benefit
fit.mlm.con = lmer(dv ~ 0 + interference/trialtype + (1 | task:Subject) + (1 | task), data=dat)
summary(fit.mlm.con)
Linear mixed model fit by REML ['lmerMod']
Formula: dv ~ 0 + interference/trialtype + (1 | task:Subject) + (1 | task)
   Data: dat

REML criterion at convergence: -507.1

Scaled residuals:
     Min       1Q   Median       3Q      Max
-2.80132 -0.47517  0.07994  0.51863  1.67146

Random effects:
 Groups       Name        Variance Std.Dev.
 task:Subject (Intercept) 0.011410 0.10682
 task         (Intercept) 0.000000 0.00000
 Residual                 0.006525 0.08078
Number of obs: 368, groups:  task:Subject, 184; task, 12

Fixed effects:
                             Estimate Std. Error t value
interferencehigh             0.788111   0.012655   62.28
interferencelow              0.855470   0.015783   54.20
interferencehigh:trialtype1 -0.000697   0.010795   -0.06
interferencelow:trialtype1  -0.029153   0.013463   -2.17

Correlation of Fixed Effects:
            intrfrnch intrfrncl intrfrnch:1
interfrnclw  0.000
intrfrnch:1 -0.427     0.000
intrfrncl:1  0.000    -0.427     0.000
Same model contrast coded for interference benefit
fit.mlm.int = lmer(dv ~ 0 + trialtype/interference + (1 | task:Subject) + (1 | task), data=dat)
summary(fit.mlm.int)
Linear mixed model fit by REML ['lmerMod']
Formula: dv ~ 0 + trialtype/interference + (1 | task:Subject) + (1 | task)
   Data: dat

REML criterion at convergence: -507.1

Scaled residuals:
     Min       1Q   Median       3Q      Max
-2.80132 -0.47517  0.07994  0.51863  1.67146

Random effects:
 Groups       Name        Variance Std.Dev.
 task:Subject (Intercept) 0.011410 0.10682
 task         (Intercept) 0.000000 0.00000
 Residual                 0.006525 0.08078
Number of obs: 368, groups:  task:Subject, 184; task, 12

Fixed effects:
                           Estimate Std. Error t value
trialtypeD                  0.78811    0.01265   62.28
trialtypeS                  0.78741    0.01265   62.22
trialtypeD:interferencelow  0.06736    0.02023    3.33
trialtypeS:interferencelow  0.03890    0.02023    1.92

Correlation of Fixed Effects:
            trltyD trltyS trltD:
trialtypeS   0.636
trltypD:ntr -0.626 -0.398
trltypS:ntr -0.398 -0.626  0.636
Why is task variance estimated to be 0?
Sanity check, injecting noise at task level. Note the accurate task variance estimates.
tmp_dat = ddply(dat, .(task), transform, dv = dv + rnorm(1, sd=.1))
fit.mlm2 = lmer(dv ~ 0 + cond + (1 | task:Subject) + (1 | task), data=tmp_dat)
summary(fit.mlm2)
Linear mixed model fit by REML ['lmerMod']
Formula: dv ~ 0 + cond + (1 | task:Subject) + (1 | task)
   Data: tmp_dat

REML criterion at convergence: -484.8

Scaled residuals:
    Min      1Q  Median      3Q     Max
-2.7572 -0.4626  0.0723  0.4978  1.6731

Random effects:
 Groups       Name        Variance Std.Dev.
 task:Subject (Intercept) 0.011633 0.10786
 task         (Intercept) 0.006169 0.07855
 Residual                 0.006525 0.08078
Number of obs: 368, groups:  task:Subject, 184; task, 12

Fixed effects:
           Estimate Std. Error t value
condhigh D  0.76056    0.03070   24.77
condhigh S  0.75987    0.03070   24.75
condlow D   0.90806    0.04237   21.43
condlow S   0.87891    0.04237   20.74

Correlation of Fixed Effects:
           cndhgD cndhgS cndlwD
condhigh S 0.938
condlow D  0.000  0.000
condlow S  0.000  0.000  0.950
Another Sanity check, looking at task variance from ANOVA standpoint. Note that the F-value for task is 1 (no between task var beyond subject var)
fit.aov = aov(dv ~ interference + task + Error(task:Subject), data=dat)
Warning in aov(dv ~ interference + task + Error(task:Subject), data =
dat): Error() model is singular
summary(fit.aov)
Error: task:Subject
              Df Sum Sq Mean Sq F value  Pr(>F)
interference   1  0.247 0.24744   8.316 0.00443 **
task          10  0.223 0.02231   0.750 0.67679
Residuals    172  5.118 0.02975
---
Signif. codes:  0 '***' 0.001 '**' 0.01 '*' 0.05 '.' 0.1 ' ' 1

Error: Within
           Df Sum Sq  Mean Sq F value Pr(>F)
Residuals 184  1.218 0.006621
Confidence Intervals
Computing bootstrap confidence intervals ...
Warning in checkConv(attr(opt, "derivs"), opt$par, ctrl =
control$checkConv, : Model failed to converge: degenerate Hessian with 1
negative eigenvalues
                                 2.5 %     97.5 %
sd_(Intercept)|task:Subject 0.09143731 0.12031009
sd_(Intercept)|task         0.00000000 0.03181937
sigma                       0.07240859 0.08893610
condhigh D                  0.76407583 0.81299562
condhigh S                  0.76267409 0.81264585
condlow D                   0.82404954 0.88601898
condlow S                   0.79537988 0.85739664
Computing bootstrap confidence intervals ...
                                  2.5 %       97.5 %
sd_(Intercept)|task:Subject  0.09118092  0.120583507
sd_(Intercept)|task          0.00000000  0.031924364
sigma                        0.07233749  0.089033429
interferencehigh             0.76275996  0.813088374
interferencelow              0.82456399  0.886600881
interferencehigh:trialtype1 -0.02170043  0.020573120
interferencelow:trialtype1  -0.05521316 -0.002708214
Cohen's d
Here, I divided group differences by either the residual variance, or between-subject variance + residual variance.
$d_high
BOOTSTRAP CONFIDENCE INTERVAL CALCULATIONS
Based on 10000 bootstrap replicates

CALL :
boot.ci(boot.out = booted, type = c("norm", "perc"), index = ii)

Intervals :
Level      Normal             Percentile
95%   (-0.1939,  0.1826 )   (-0.1960,  0.1811 )
Calculations and Intervals on Original Scale

$d_low
BOOTSTRAP CONFIDENCE INTERVAL CALCULATIONS
Based on 10000 bootstrap replicates

CALL :
boot.ci(boot.out = booted, type = c("norm", "perc"), index = ii)

Intervals :
Level      Normal             Percentile
95%   (-0.4929, -0.0162 )   (-0.4969, -0.0176 )
Calculations and Intervals on Original Scale

$d_sub_high
BOOTSTRAP CONFIDENCE INTERVAL CALCULATIONS
Based on 10000 bootstrap replicates

CALL :
boot.ci(boot.out = booted, type = c("norm", "perc"), index = ii)

Intervals :
Level      Normal             Percentile
95%   (-0.1417,  0.1335 )   (-0.1430,  0.1327 )
Calculations and Intervals on Original Scale

$d_sub_low
BOOTSTRAP CONFIDENCE INTERVAL CALCULATIONS
Based on 10000 bootstrap replicates

CALL :
boot.ci(boot.out = booted, type = c("norm", "perc"), index = ii)

Intervals :
Level      Normal             Percentile
95%   (-0.3592, -0.0124 )   (-0.3597, -0.0126 )
Calculations and Intervals on Original Scale
Plotting
Means and Standard Errors
The following `from` values were not present in `x`: Ospan.reg
p +
  geom_rect(aes(x=NULL, y=NULL, shape=NULL,xmin=xmin, xmax=xmax, ymin=ymin, ymax=ymax),
            color='black', fill='white', data=group_annot) +
  geom_text(aes(shape=NULL, color=NULL, x=text.x, y=text.y, label=label),
            show_guide=FALSE, data=group_annot) + pub_theme + colors + shapes
Scale for 'colour' is already present. Adding another scale for 'colour', which will replace the existing scale.
Scale for 'shape' is already present. Adding another scale for 'shape', which will replace the existing scale.
ymax not defined: adjusting position using y instead
title: "1_mlm.R" author: "machow" date: "Wed Jan 13 12:04:19 2016"