Multilevel model of accuracy
Params:
params
$dv_var
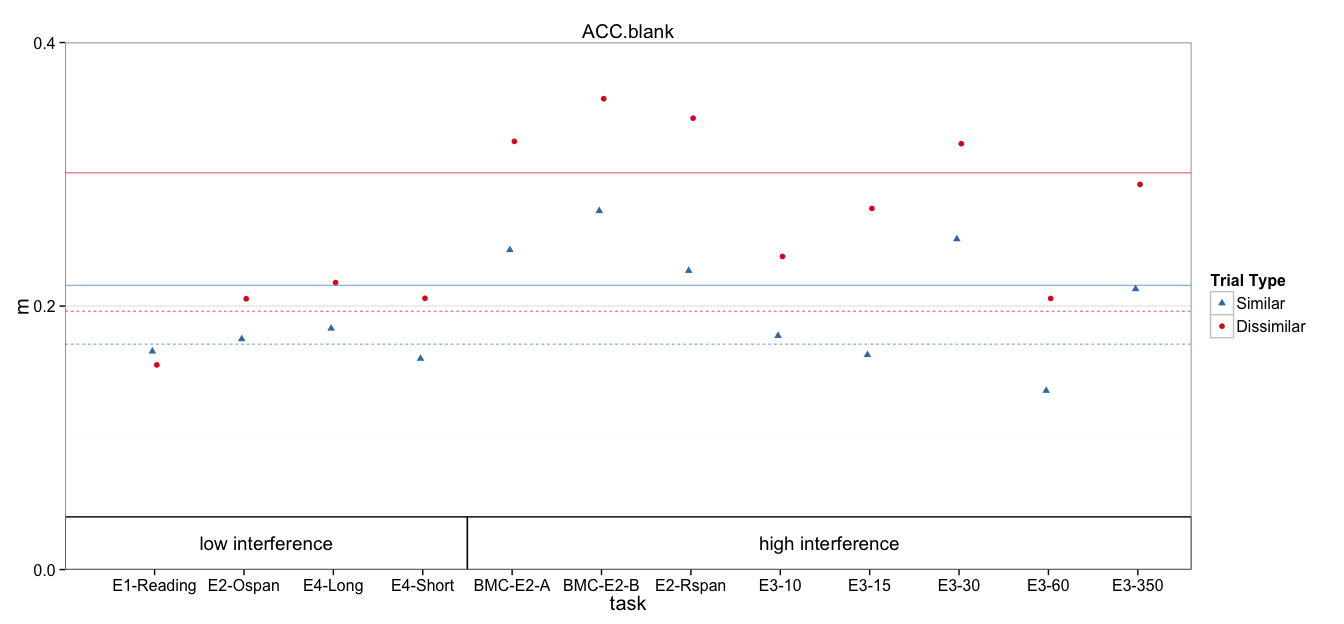
[1] "ACC.blank"
$nsim
[1] 10000
$plot_ymax
[1] 0.4
$plot_yshift
[1] 0
Read in data
DV_VAR = params$dv_var

all.dat = read.csv('data/1_scored.csv')
all.dat$Subject = factor(all.dat$Subject)
all.dat$dv = all.dat[,DV_VAR]

# Remove regular ospan, which has substantially lower accuracy
# due to verification requirements
dat = subset(all.dat, !task %in% 'Ospan.reg')

# Mark high and low interference conditions
low_int = c('spOspan.noVer', 'Ospan.scram.noVer', 'Rspan.names.long', 'Rspan.names.short', 'Ospan.reg')
dat$interference = ifelse(dat$task %in% low_int, 'low', 'high')
Models
dat$cond = paste(dat$interference, dat$trialtype)
contrasts(dat$trialtype) <- c(0,1)                # similarity increment
Model with recall predictions for each interference:trialtype explicit
fit.mlm = lmer(dv ~ 0 + cond + (1 | task:Subject) + (1 | task), data=dat)
summary(fit.mlm)
Linear mixed model fit by REML ['lmerMod']
Formula: dv ~ 0 + cond + (1 | task:Subject) + (1 | task)
   Data: dat

REML criterion at convergence: -642.7

Scaled residuals:
     Min       1Q   Median       3Q      Max
-1.96881 -0.52096 -0.02076  0.47433  2.27994

Random effects:
 Groups       Name        Variance  Std.Dev.
 task:Subject (Intercept) 0.0103724 0.10184
 task         (Intercept) 0.0006673 0.02583
 Residual                 0.0036110 0.06009
Number of obs: 368, groups:  task:Subject, 184; task, 12

Fixed effects:
           Estimate Std. Error t value
condhigh D  0.30118    0.01457  20.678
condhigh S  0.21569    0.01457  14.809
condlow D   0.19600    0.01901  10.310
condlow S   0.17105    0.01901   8.998

Correlation of Fixed Effects:
           cndhgD cndhgS cndlwD
condhigh S 0.848
condlow D  0.000  0.000
condlow S  0.000  0.000  0.861
Same model contrast coded for similarity benefit
fit.mlm.con = lmer(dv ~ 0 + interference/trialtype + (1 | task:Subject) + (1 | task), data=dat)
summary(fit.mlm.con)
Linear mixed model fit by REML ['lmerMod']
Formula: dv ~ 0 + interference/trialtype + (1 | task:Subject) + (1 | task)
   Data: dat

REML criterion at convergence: -642.7

Scaled residuals:
     Min       1Q   Median       3Q      Max
-1.96881 -0.52096 -0.02076  0.47433  2.27994

Random effects:
 Groups       Name        Variance  Std.Dev.
 task:Subject (Intercept) 0.0103724 0.10184
 task         (Intercept) 0.0006673 0.02583
 Residual                 0.0036110 0.06009
Number of obs: 368, groups:  task:Subject, 184; task, 12

Fixed effects:
                            Estimate Std. Error t value
interferencehigh             0.30118    0.01456  20.678
interferencelow              0.19600    0.01901  10.310
interferencehigh:trialtype1 -0.08548    0.00803 -10.645
interferencelow:trialtype1  -0.02495    0.01001  -2.491

Correlation of Fixed Effects:
            intrfrnch intrfrncl intrfrnch:1
interfrnclw  0.000
intrfrnch:1 -0.276     0.000
intrfrncl:1  0.000    -0.263     0.000
Same model contrast coded for interference benefit
fit.mlm.int = lmer(dv ~ 0 + trialtype/interference + (1 | task:Subject) + (1 | task), data=dat)
summary(fit.mlm.int)
Linear mixed model fit by REML ['lmerMod']
Formula: dv ~ 0 + trialtype/interference + (1 | task:Subject) + (1 | task)
   Data: dat

REML criterion at convergence: -642.7

Scaled residuals:
     Min       1Q   Median       3Q      Max
-1.96881 -0.52096 -0.02076  0.47433  2.27994

Random effects:
 Groups       Name        Variance  Std.Dev.
 task:Subject (Intercept) 0.0103724 0.10184
 task         (Intercept) 0.0006673 0.02583
 Residual                 0.0036110 0.06009
Number of obs: 368, groups:  task:Subject, 184; task, 12

Fixed effects:
                           Estimate Std. Error t value
trialtypeD                  0.30118    0.01457  20.678
trialtypeS                  0.21569    0.01457  14.809
trialtypeD:interferencelow -0.10518    0.02395  -4.392
trialtypeS:interferencelow -0.04464    0.02395  -1.864

Correlation of Fixed Effects:
            trltyD trltyS trltD:
trialtypeS   0.848
trltypD:ntr -0.608 -0.516
trltypS:ntr -0.516 -0.608  0.856
Why is task variance estimated to be 0?
Sanity check, injecting noise at task level. Note the accurate task variance estimates.
tmp_dat = ddply(dat, .(task), transform, dv = dv + rnorm(1, sd=.1))
fit.mlm2 = lmer(dv ~ 0 + cond + (1 | task:Subject) + (1 | task), data=tmp_dat)
summary(fit.mlm2)
Linear mixed model fit by REML ['lmerMod']
Formula: dv ~ 0 + cond + (1 | task:Subject) + (1 | task)
   Data: tmp_dat

REML criterion at convergence: -617.9

Scaled residuals:
     Min       1Q   Median       3Q      Max
-1.98435 -0.50968 -0.03459  0.50093  2.23783

Random effects:
 Groups       Name        Variance Std.Dev.
 task:Subject (Intercept) 0.010316 0.10157
 task         (Intercept) 0.018815 0.13717
 Residual                 0.003611 0.06009
Number of obs: 368, groups:  task:Subject, 184; task, 12

Fixed effects:
           Estimate Std. Error t value
condhigh D  0.34080    0.04985   6.837
condhigh S  0.25532    0.04985   5.122
condlow D   0.22499    0.06998   3.215
condlow S   0.20004    0.06998   2.858

Correlation of Fixed Effects:
           cndhgD cndhgS cndlwD
condhigh S 0.987
condlow D  0.000  0.000
condlow S  0.000  0.000  0.990
Another Sanity check, looking at task variance from ANOVA standpoint. Note that the F-value for task is 1 (no between task var beyond subject var)
fit.aov = aov(dv ~ interference + task + Error(task:Subject), data=dat)
Warning in aov(dv ~ interference + task + Error(task:Subject), data =
dat): Error() model is singular
summary(fit.aov)
Error: task:Subject
              Df Sum Sq Mean Sq F value   Pr(>F)
interference   1  0.551  0.5512  22.735 3.94e-06 ***
task          10  0.453  0.0453   1.867   0.0529 .
Residuals    172  4.170  0.0242
---
Signif. codes:  0 '***' 0.001 '**' 0.01 '*' 0.05 '.' 0.1 ' ' 1

Error: Within
           Df Sum Sq  Mean Sq F value Pr(>F)
Residuals 184  1.089 0.005918
Confidence Intervals
Computing bootstrap confidence intervals ...
                                 2.5 %     97.5 %
sd_(Intercept)|task:Subject 0.08869968 0.11422816
sd_(Intercept)|task         0.00000000 0.04766740
sigma                       0.05387611 0.06631253
condhigh D                  0.27211709 0.32971688
condhigh S                  0.18689148 0.24381496
condlow D                   0.15923760 0.23260279
condlow S                   0.13401851 0.20743528
Computing bootstrap confidence intervals ...
Warning in checkConv(attr(opt, "derivs"), opt$par, ctrl =
control$checkConv, : Model failed to converge: degenerate Hessian with 1
negative eigenvalues
                                  2.5 %       97.5 %
sd_(Intercept)|task:Subject  0.08890041  0.114073816
sd_(Intercept)|task          0.00000000  0.047286879
sigma                        0.05373984  0.066324905
interferencehigh             0.27294774  0.329596941
interferencelow              0.15869892  0.232917837
interferencehigh:trialtype1 -0.10089619 -0.070130948
interferencelow:trialtype1  -0.04462576 -0.004898316
Cohen's d
Here, I divided group differences by either the residual variance, or between-subject variance + residual variance.
Warning in checkConv(attr(opt, "derivs"), opt$par, ctrl =
control$checkConv, : Model failed to converge: degenerate Hessian with 1
negative eigenvalues
$d_high
BOOTSTRAP CONFIDENCE INTERVAL CALCULATIONS
Based on 10000 bootstrap replicates

CALL :
boot.ci(boot.out = booted, type = c("norm", "perc"), index = ii)

Intervals :
Level      Normal             Percentile
95%   (-1.215, -0.791 )   (-1.228, -0.803 )
Calculations and Intervals on Original Scale

$d_low
BOOTSTRAP CONFIDENCE INTERVAL CALCULATIONS
Based on 10000 bootstrap replicates

CALL :
boot.ci(boot.out = booted, type = c("norm", "perc"), index = ii)

Intervals :
Level      Normal             Percentile
95%   (-0.5252, -0.0591 )   (-0.5332, -0.0634 )
Calculations and Intervals on Original Scale

$d_sub_high
BOOTSTRAP CONFIDENCE INTERVAL CALCULATIONS
Based on 10000 bootstrap replicates

CALL :
boot.ci(boot.out = booted, type = c("norm", "perc"), index = ii)

Intervals :
Level      Normal             Percentile
95%   (-0.7727, -0.5137 )   (-0.7775, -0.5166 )
Calculations and Intervals on Original Scale

$d_sub_low
BOOTSTRAP CONFIDENCE INTERVAL CALCULATIONS
Based on 10000 bootstrap replicates

CALL :
boot.ci(boot.out = booted, type = c("norm", "perc"), index = ii)

Intervals :
Level      Normal             Percentile
95%   (-0.3359, -0.0390 )   (-0.3379, -0.0411 )
Calculations and Intervals on Original Scale
Plotting
Means and Standard Errors
The following `from` values were not present in `x`: Ospan.reg
p +
  geom_rect(aes(x=NULL, y=NULL, shape=NULL,xmin=xmin, xmax=xmax, ymin=ymin, ymax=ymax),
            color='black', fill='white', data=group_annot) +
  geom_text(aes(shape=NULL, color=NULL, x=text.x, y=text.y, label=label),
            show_guide=FALSE, data=group_annot) + pub_theme + colors + shapes
Scale for 'colour' is already present. Adding another scale for 'colour', which will replace the existing scale.
Scale for 'shape' is already present. Adding another scale for 'shape', which will replace the existing scale.
ymax not defined: adjusting position using y instead
title: "1_mlm.R" author: "machow" date: "Wed Jan 13 12:13:02 2016"